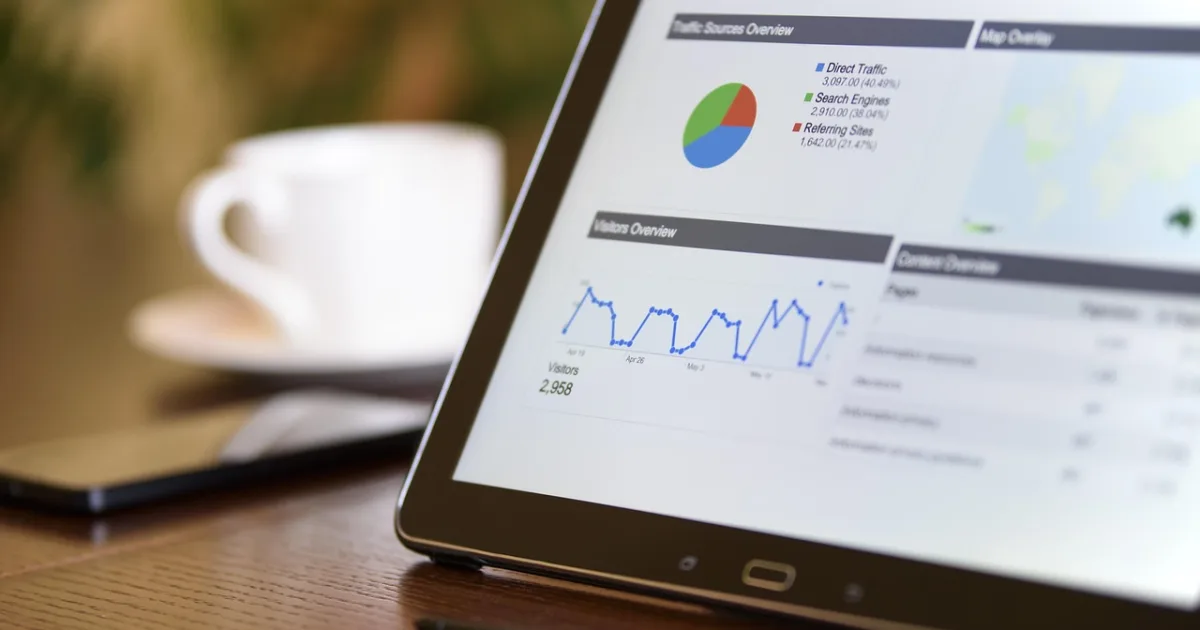
A coffee robot's profitability doesn't stop on the day it is installed: that's when it starts to take shape. Once the machine is in place, a few indicators tracked each month on a simple dashboard tell you where your margin comes from, what is holding it back, and what you can correct. Here are the figures to watch, in order, and the questions to ask before buying so you can track them.
Why track figures on a machine that runs by itself
A coffee robot sells without staff, but it doesn't manage itself. 2 identical machines can earn very different margins depending on the location, the drink menu, the prices, and the time they are actually in service.
A vending coffee machine does have one advantage over a traditional café: every sale goes through the machine, so it can be counted. You don't have to guess what works. You still need to look at the right figures, and look at them regularly.
The goal is not to pile up statistics. It is to answer 3 simple questions every month:
- Is the machine selling as much as expected?
- Does each sale earn what it should?
- What costs more than planned?
Sales per day, and above all per hour
The first indicator is the number of drinks sold per day. It has the biggest effect on profitability, and it depends the most on the location.
A monthly average is not enough. Look at the breakdown:
- by day of the week: an office location sells mostly on weekdays, a shopping centre on Saturdays;
- by hour: the morning, lunch break, or end-of-class peaks show when your customers pass by;
- by month: weather, holidays, and events at the site make footfall vary.
These curves help you act. A very sharp peak at a specific hour signals a moment when the machine must not be empty or broken down. Entire days that are very quiet can justify a discussion with the site about the machine's visibility or its place in the building. The criteria for assessing a site are detailed in our article on choosing the location.
Average basket and the weight of each drink
The second indicator is the average amount of a sale. It rises when customers choose more elaborate drinks, larger sizes, or add an option.
Also track each drink's share of sales. You will quickly see that a small part of the menu accounts for most of the volume. That is not a problem in itself, but it raises 2 questions:
- Are the best-selling drinks also the ones that earn the most?
- Do the drinks that barely sell deserve their place on the screen?
Removing a rarely requested drink simplifies restocking and highlights the ones that matter. Adding a seasonal drink can, on the other hand, revive interest among regulars. Our article on the coffee robot menu explains how to build the menu and change it over time.
Ingredient cost per drink
The margin on a sale is its price excluding VAT minus what it consumes: coffee, milk, syrup, cup, lid. This ingredient cost varies from one drink to another, and it moves with your supply prices.
Calculate it at least once for each drink on the menu, then recalculate it each time purchase prices change. Then compare 2 figures:
- the quantity of supplies you bought over the month;
- the quantity your sales should have consumed.
A significant gap signals something other than a simple price increase: a dosing setting to check, losses during restocking, expired products thrown away. This is often where part of the lost margin is hiding.
Availability: the hours when the machine isn't selling
A machine that is broken down, out of cups, or out of milk sells nothing. And these lost hours often fall at the worst moment, during peaks, when demand is highest.
Record each month:
- the number of stoppages and how long they lasted;
- their cause: breakdown, ingredient shortage, payment problem, power cut at the site;
- the time between the alert and the machine being back in service.
If shortages keep coming back, the restocking schedule is too loose for the sales volume. If breakdowns keep coming back, it is a matter to raise with after-sales service. Our article on the risks of a coffee vending machine covers this item, which is often underestimated when investing.
Fixed costs relative to sales
Some costs don't depend on the number of drinks sold: the fee paid to the site if it is fixed, insurance, the maintenance contract, the connection, and the time you spend restocking.
Divide them each month by the number of drinks sold. This figure shows how much each drink must first repay before generating a real margin. It falls when sales rise, and it tells you from which volume the machine covers its costs.
If the fee is a share of sales, it follows your revenue: include it then in the margin calculation for each drink. The different formulas and their effect on profitability are explained in our article on the location contract.
Comparing each month with your starting forecast
Before investing, you built a forecast: sales per day, average price, ingredient cost, costs. This starting table becomes your benchmark.
Each month, put the forecast and the actual figures side by side. The gap tells you where to act:
- sales below forecast: location, visibility, the site's opening hours, machine availability;
- average basket below forecast: menu, prices, promotion of drinks;
- ingredient cost above forecast: purchase prices, dosing, losses;
- costs above forecast: contract, electricity consumption, call-outs.
The first months are often a break-in period: the time it takes for the site's habits to form. Judge a trend over several months rather than over a single week. The method for building this forecast is detailed in our article on calculating margin and return on investment, and the key figures are on the investment page.
What to check before buying
To track these indicators without spending your evenings on it, the question of data arises as soon as you choose the machine. Before investing, ask:
- what data the machine records: sales by drink, by hour, by payment method;
- whether you can consult it remotely, or only on site;
- whether you can export it to a spreadsheet;
- whether the machine warns you of a breakdown or a shortage, and how;
- whether you can change a price or remove a drink yourself.
These answers matter as much as the purchase price: a machine you manage well earns more than a machine you discover at each visit.
A 1-hour meeting each month
Tracking doesn't require heavy organisation. 1 hour a month is often enough: pull the sales figures, recalculate the margin per drink, note the stoppages, compare with the forecast, and decide on 1 or 2 actions for the following month. A menu change, a rescheduled restocking visit, or a discussion with the site.
Over the months, this dashboard also becomes an argument: with the site that hosts you when renegotiating, with your bank when financing a second machine, or when judging whether it is useful to add an ice cream robot alongside the coffee machine, as we explain in this article.
If you want to see what the data of a coffee robot looks like, or to prepare your own forecast, feel free to contact us.